Data Visualization
Overview
Data visualization is the process of representing data in a visual form, such as charts, graphs, and other visual elements. It helps us to discover patterns, trends, and correlations in the data, as well as provide insights and understanding. Through data visualization, we can gain a better understanding of the meaning of the data, communicate and explain the results, and support data-driven decision making and communication.
Example: Visualize Iris Dataset
Task
Use DataInterpreter to perform a simple data analysis and visualize the sklearn Iris dataset.
Code
python examples/di/data_visualization.pypython examples/di/data_visualization.pyThe code in examples/di/data_visualization.py is as follows:
import asyncio
from metagpt.logs import logger
from metagpt.roles.di.data_interpreter import DataInterpreter
from metagpt.utils.recovery_util import save_history

async def main(requirement: str = ""):

    di = DataInterpreter()
    rsp = await di.run(requirement)
    logger.info(rsp)
    save_history(role=di)


if __name__ == "__main__":

    requirement = "Run data analysis on sklearn Iris dataset, include a plot"
    asyncio.run(main(requirement))
import asyncio
from metagpt.logs import logger
from metagpt.roles.di.data_interpreter import DataInterpreter
from metagpt.utils.recovery_util import save_history
async def main(requirement: str = ""):
di = DataInterpreter()
rsp = await di.run(requirement)
logger.info(rsp)
save_history(role=di)
if __name__ == "__main__":
requirement = "Run data analysis on sklearn Iris dataset, include a plot"
asyncio.run(main(requirement))By executing the above code, the generated plan and code will be saved separately in data/output/current_time/plan.json and data/output/current_time/code.ipynb, respectively.
Execution Results
DataInterpreterproposes the following solution tasks:
[
  {
    "task_id": "1",
    "dependent_task_ids": [],
    "instruction": "Load the Iris dataset from sklearn."
  },
  {
    "task_id": "2",
    "dependent_task_ids": ["1"],
    "instruction": "Perform exploratory data analysis on the Iris dataset."
  },
  {
    "task_id": "3",
    "dependent_task_ids": ["2"],
    "instruction": "Create a plot visualizing the Iris dataset features."
  }
]
[
{
"task_id": "1",
"dependent_task_ids": [],
"instruction": "Load the Iris dataset from sklearn."
},
{
"task_id": "2",
"dependent_task_ids": ["1"],
"instruction": "Perform exploratory data analysis on the Iris dataset."
},
{
"task_id": "3",
"dependent_task_ids": ["2"],
"instruction": "Create a plot visualizing the Iris dataset features."
}
]DataInterpreter is able to divide the problem into logical tasks, and And run according to the steps of loading the data, analyzing the data, and plotting the chart.
DataInterpreterwrites the following code:
# ----------------------------------task1------------------------------------
from sklearn.datasets import load_iris
iris_data = load_iris()
iris_data.keys()
!pip install scikit-learn
from sklearn.datasets import load_iris
iris_data = load_iris()
iris_data.keys()
# ----------------------------------task2------------------------------------
import pandas as pd

# Create a DataFrame from the iris dataset
iris_df = pd.DataFrame(iris_data['data'], columns=iris_data['feature_names'])
iris_df['species'] = pd.Categorical.from_codes(iris_data['target'], iris_data['target_names'])

# Summary statistics
summary_statistics = iris_df.describe()

# Check for missing values
missing_values = iris_df.isnull().sum()

(summary_statistics, missing_values)
# ----------------------------------task3------------------------------------
import matplotlib.pyplot as plt
import seaborn as sns

# Use seaborn's pairplot to visualize the dataset features
sns.set(style='whitegrid', context='notebook')
iris_pairplot = sns.pairplot(iris_df, hue='species', height=2.5)
plt.show()
# ----------------------------------task1------------------------------------
from sklearn.datasets import load_iris
iris_data = load_iris()
iris_data.keys()
!pip install scikit-learn
from sklearn.datasets import load_iris
iris_data = load_iris()
iris_data.keys()
# ----------------------------------task2------------------------------------
import pandas as pd
# Create a DataFrame from the iris dataset
iris_df = pd.DataFrame(iris_data['data'], columns=iris_data['feature_names'])
iris_df['species'] = pd.Categorical.from_codes(iris_data['target'], iris_data['target_names'])
# Summary statistics
summary_statistics = iris_df.describe()
# Check for missing values
missing_values = iris_df.isnull().sum()
(summary_statistics, missing_values)
# ----------------------------------task3------------------------------------
import matplotlib.pyplot as plt
import seaborn as sns
# Use seaborn's pairplot to visualize the dataset features
sns.set(style='whitegrid', context='notebook')
iris_pairplot = sns.pairplot(iris_df, hue='species', height=2.5)
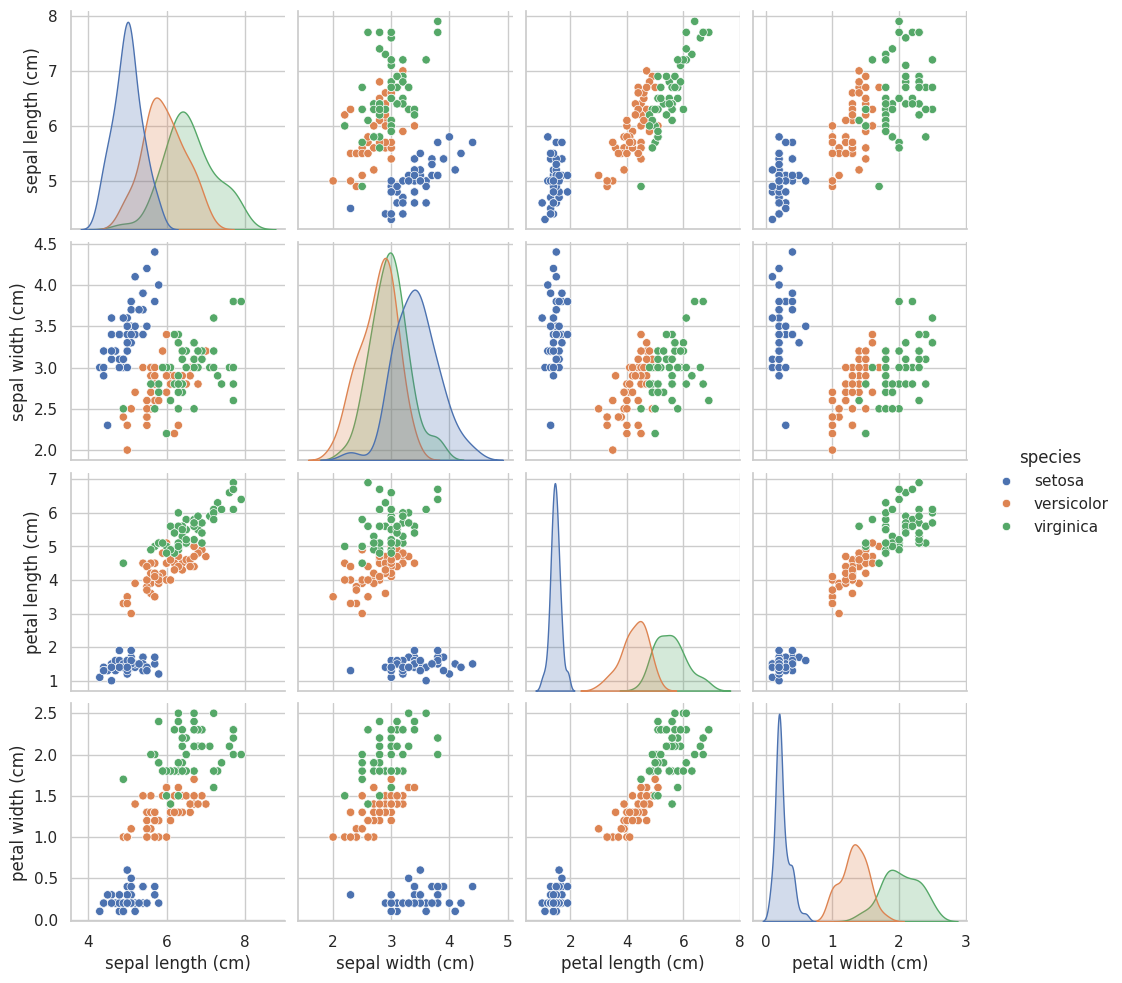
plt.show()During the completion of task 1, an error occurred on the first execution due to the lack of scikit-learn installed in the environment. However, DataInterpreter can analyze and resolve this issue by installing scikit-learn. In task 3, DataInterpreter uses the pairplot function from seaborn to create a scatterplot matrix, which visualizes the relationships between different features in the dataset and differentiates data points of different species using colors. Finally, plt.show() is used to display the graph.
Below is the graph plotted by DataInterpreter running the code. It is evident that the code executed successfully and generated a beautiful visualization table, which can help us analyze the features of the dataset more effectively.